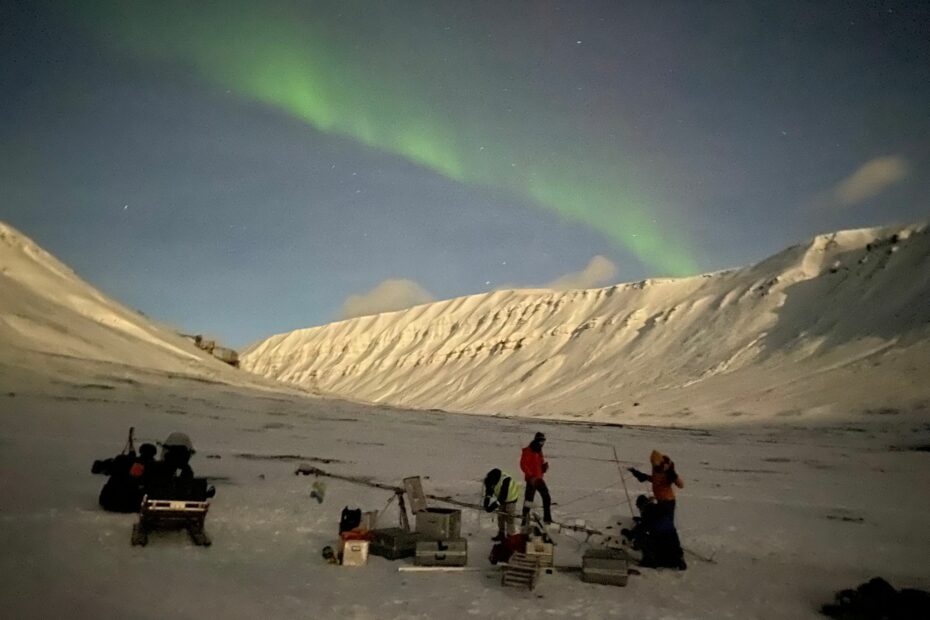
Cover image: Installing the weather station under the northern lights. (photo courtesy of F. Gebhardt)
This polar week, APECS Germany board member Lukas takes you along his recent fieldwork in the High Arctic. Enjoy!
Fieldwork in the polar regions of the Earth is exciting, beautiful, hard, motivating and a dream of many students. If you don’t know about the University Centre in Svalbard (UNIS) yet, it might also seem extremely difficult to achieve. But at UNIS you can use the Arctic as a laboratory and learn about important Arctic topics in the fields of Biology, Technology, Geology and Geophysics.
Let me give you some impressions from my fieldwork in Svalbard. I am a master/grad student in Meteorology and already studied at UNIS for one semester two years ago. This winter I came back to learn about the Arctic atmospheric boundary layer (course AGF350, see https://www.unis.no/studies/). The boundary layer is the lowermost part of the atmosphere, which is strongly impacted by interactions with the Earth’s surface.
The course started with an extensive safety course, covering avalanche danger, polar bear protection and other essential polar safety skills. We had a bunch of lectures about the atmospheric boundary layer and turbulence to lay a base for our fieldwork. Then, we had one week of fieldwork prep. Most importantly, each group had to find a research question that we wanted to investigate and plan our campaign accordingly. My group chose to look at the turbulent structure of katabatic winds in one of the side valleys close to Longyearbyen.
What are katabatic winds you ask? They are local winds that often form during calm and clear nights, when the surface cools very effectively. This leads to a temperature inversion, where the air is colder close to the surface and warmer higher up (opposite of the normal temperature gradient in the atmosphere) and cold air is denser than warm air. If these conditions are met on a slope, the cold and dense air at the surface experiences a stronger gravitational force, which leads to a katabatic wind blowing down the slope.
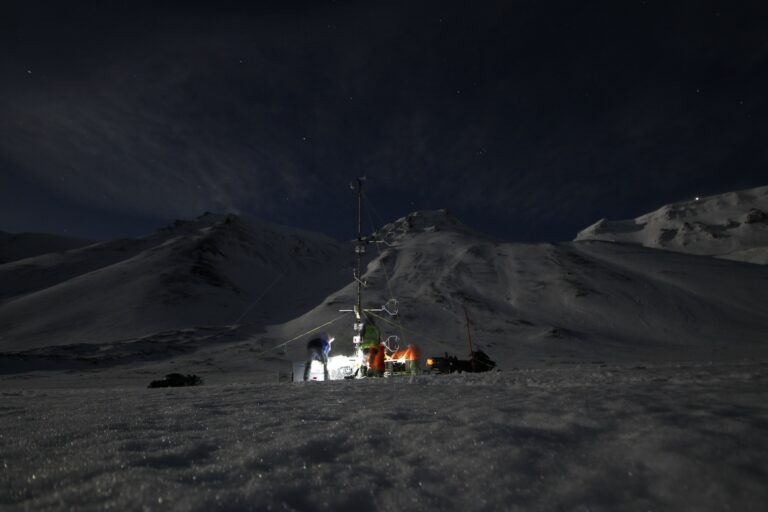
We also tested all of the instruments and practiced setting up our 6m tall weather station before heading out in the field. The most important instruments were 3 high frequency 3D anemometers (instruments that measure wind speed) that were installed at different heights, from which we could calculate the turbulence. All of our equipment was transported to our chosen site with snow scooters and then the setup could begin. With a few short breaks to warm up cold hands and feet as well as looking at the northern lights, our station was up and running after around 6 hours. We visited our station every day to secure the data and check the batteries. During the first two days we discovered a problem with one of the data loggers, which we luckily solved and then everything was running smoothly, which is not granted in this environment.
The one week campaign took place at the end of January, so there were only very few hours of dawn/dusk. On a few days we had strong winds, snowfall and blowing snow, which made the visibility even worse. That made it important for us to keep the time during which we were in the field short to minimize exposure to avalanche danger, since we couldn’t observe how the conditions on the slope above us changed.
When the conditions allowed it we also did drone flights to measure vertical profiles of air temperature, humidity and pressure to have more spatial context for our measurements at the weather station. The other groups did drone profiles as well at other locations to get better spatial coverage and measurements at the same time. And even though we mostly worked with only our group we were always in contact with the other groups to coordinate the logistics and help each other. Nearly all of the individual projects could also gain important additional information from measurements by the other groups. This multi-level coordination, cooperation and communication really is a lesson for itself and extremely satisfying when it works out. But it also includes that someone misunderstands and does a measurement incorrectly or forgets to take notes (the best tip here is to just take notes of everything, it’ll always be relevant to someone 🙂). Especially if you are cold and tired it’s easy to forget something and the best thing you can do is to share some cookies, dance until you’re warm and improvise and adapt.
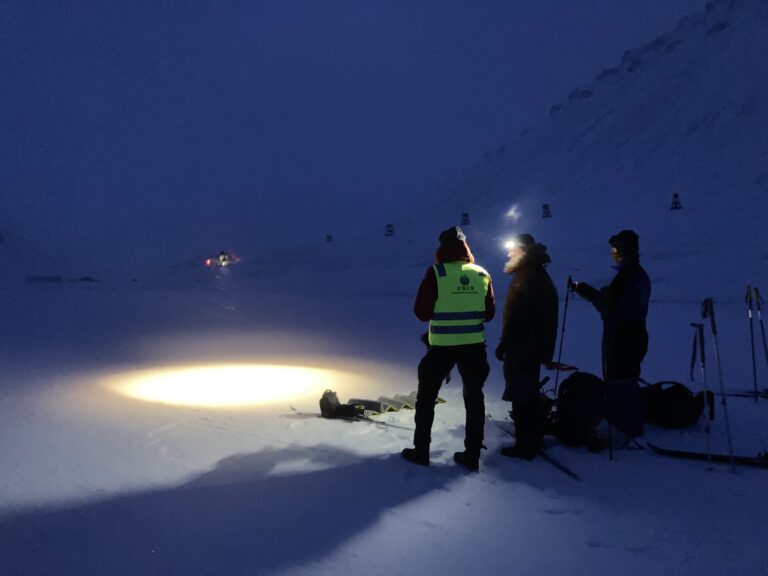
On one of the days we decided to not use carbon emitting transport like snow scooters and skied to our weather station to retrieve the data and do the drone profiles. It was a great way to understand the logistics of field campaigns better and consider what you really need. There are some important limitations, such as the equipment you can bring or the distance to travel and time consumption. It would not have been possible on the days of the instrument setup and it also increases the safety risks. But it also gave us much more time to evaluate the surroundings, do manual weather and snow observations, appreciate the beautiful surroundings without noise and value the measurements more. On this day we saw extremely fresh footprints of a polar fox at our weather station when we arrived. Because of the bad visibility we never saw it even though it was only 50 m away and one of us was always on polar bear watch.
After the station was taken down again the hardest part of the work started. It’s not a huge number, but our three instruments produced more than 20 GB of raw data. I don’t want to hit you with the detailed analysis of the turbulent fluxes, but I want to at least show that we were very successful in measuring katabatic winds 🎉.
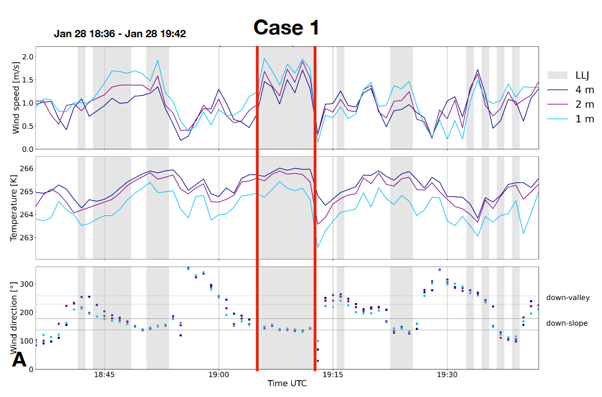
Fig. 1 shows the wind speed, air temperature and wind direction from top to bottom. In the case marked by the red lines the temperature of the lowest instrument at 1 m height (light blue) is colder than the other two. This shows the temperature inversion which is essential for katabatic winds, as I explained previously. A low-level jet (LLJ) is an important feature of katabatic winds. Normally the wind speed increases with height, but in the case of a LLJ there is a maximum wind speed relatively close to the ground and weaker wind above. We can see that in this case the wind speed is highest at 1 m height and slower above. Therefore, this can be used as a confirmation of katabatic winds. Additionally, the wind direction indicates down-slope winds which is expected, as sloping terrain is a prerequisite for katabatic winds.
Other groups in our course used a balloon to do profile observations in the atmosphere up to 700 m high and measured carbon fluxes from the tundra and fjord and investigated the effect of the valleys on wind and temperature. Together, all of these smaller projects give an extensive overview of processes in the atmospheric boundary layer in Svalbard.
Once again, I had a really great time at UNIS and especially in the field. Thanks to all the great teachers and students. And I hope I was able to inspire you to pursue your fieldwork dreams in the Arctic!
PS: Because every campaign needs a good acronym we called our campaign the “Turbulence and Complex Terrain Investigation Campaign – Adventdalen” (TaCTIC-A) 😉.